
By Chris Officer
Staff Writer
1) What does the flattening yield curve signal, a recession or is it just noise?
• Lowenstein: The flattening yield curve should be watched closely as historically it has been a strong early leading indicator of end of cycle dynamics. However, a flat curve can persist for a significant period of time without a recession or peak in the stock market.
The flattening generally means the Fed is getting close to the neutral rate of interest rates where central bank policy is no longer accommodative and perhaps even achieving an equilibrium state. The real concern is when the curve actually inverts, becomes downward sloping and stays there, this condition has preceded the last several recessions. As a general rule, this suggest the cycle is turning over.
Markets are left to wonder if the Fed overtightens and something breaks as history would predict. One caveat is that the shape of the curve could have the potential for a false negative signal here. One cannot overlook the impact of Central Bank behavioral on the curve both from our government and foreign players buying our bonds because spreads are so wide that it pays to arbitrage markets. There has been a tsunami of capital into our markets from abroad holding down our rates below normal, distorting the shape of the curve absent these conditions.
In our view, the economy is likely in the early-late cycle phase with some runway ahead before the next recession. At this point, the Fed isn’t tightening per se but rather simply normalizing policy, moving away from extraordinarily easy conditions that lingered too long from the last recession. No doubt, there are issues surfacing such as stress in auto loans, student debt, credit cards, and lower quality bonds which need to be refinanced at higher rates in the next few years. There will be a shakeout in these markets and funding won’t be as available as in the past during zero rates and quantitative easing.
However, there are still plenty of indicators suggesting the end of cycle conditions haven’t quite arrived yet such as tight credit spreads, steady employment and wage gains, confidence indicators near all-time highs, capital investment spending inflecting higher, banks overcapitalized and eager to lend. Not to mention, there are enormous benefits coming from tax reform, government spending and de-regulation efforts poised to spur the economy above trend and potentially raise our growth speed limit.
2) What are the biggest opportunities and pitfalls in rebalancing a portfolio in light of rising interest rates?
• Lowenstein: For a significant period of time, we have favored being underweight duration and keeping maturities very short to take advantage of an impending rising rate environment. This was based on the belief that a gradual withdrawal of monetary stimulus and improving economic conditions would lead to a higher likelihood of rising inflation and interest rates, thereby creating downside risk for bond prices over the near-term.
Pressures from a rise in interest rates is underway as the Fed reduces its bond buying program and the market factors in an increase in real rates and inflation given the strong growth backdrop and reduced tax revenues from deficit financed tax reform requiring significantly more debt issuance in the future.
From a fixed income positioning perspective, we have favored Corporate Credit and Agencies, while underweighting Treasuries, MBS and CMBS. A low but stable corporate credit spread will deliver positive carry in a low and gradually rising rate environment.
3) The economy still looks strong and tax cuts will help corporate profits. Does that translate into higher stock prices?
• Lowenstein: The economy and corporate profits will get a substantial positive boost from tax reform but that doesn’t necessarily translate into commensurately higher stock prices. For 2018, it looks like tax reform will add .5 percent to .75 percent to GDP growth and 8 percent to 10 percent to corporate profits translating into 2.8-3.0 percent annual GDP growth and 18-20 percent year over year earnings growth. Unfortunately, we began the year with a price/earnings ratio (P/E) of 18.5x forward earnings, the highest level of valuation since the 1990s technology bubble.
The appropriate level of stock market valuations is more art than science but tends to be driven by many factors and cross currents including inflation, interest rates, geopolitical risks, investor risk appetite and sentiment, and where we are in the economic and market cycle to name a few. Valuation expansion this cycle has largely run its course rising from 10x P/E at the trough levels of 2009 to 18.5x at the end of 2017 and a long term median P/E of 16x. Looking back, multiple expansion has contributed roughly half of returns this cycle in addition to an earnings growth recovery and dividend payouts.
We believed that valuations would compress in this year based on a re-pricing of risk assets given late cycle fatigue and higher inflation and interest rates around the corner. Higher interest rate can have a double barrel negative impact on equities. Competition from higher bond yields draws capital allocation to fixed income away from equities at the margin and the higher discount rates translate into lower equity prices on a net present value basis. On balance, with respect to equity return expectations this year, the powerful beneficial impact of fiscal stimulus is likely going to be dampened significantly by multiple compression. As a consequence, returns will have been pulled forward and will moderate going forward even if the cycle is extended further.
4) Give us your predictions on the S&P 500 and the 10-year Treasury yield at yearend and what will the Fed do in June and for the rest of the year.
• Lowenstein: Our S&P 500 price forecast for 2018 is 2,875 at the mid-point of our range estimate which translates into roughly 8-10 percent total return and factors in above trend GDP growth with fiscal stimulus, 18-20 percent earnings growth and P/E compression to 16-17x mid-cycle, normalized levels.
Our 10 year Treasury Yield forecast is 3 percent at the mid-point of our range estimate. We fully expect the Federal Reserve to continue on its rate normalization path and to raise rates three to four times in 2018, including a hike this June.
• Extra Credit: Now that the Bitcoin fever is broken, is it bound to go to zero?
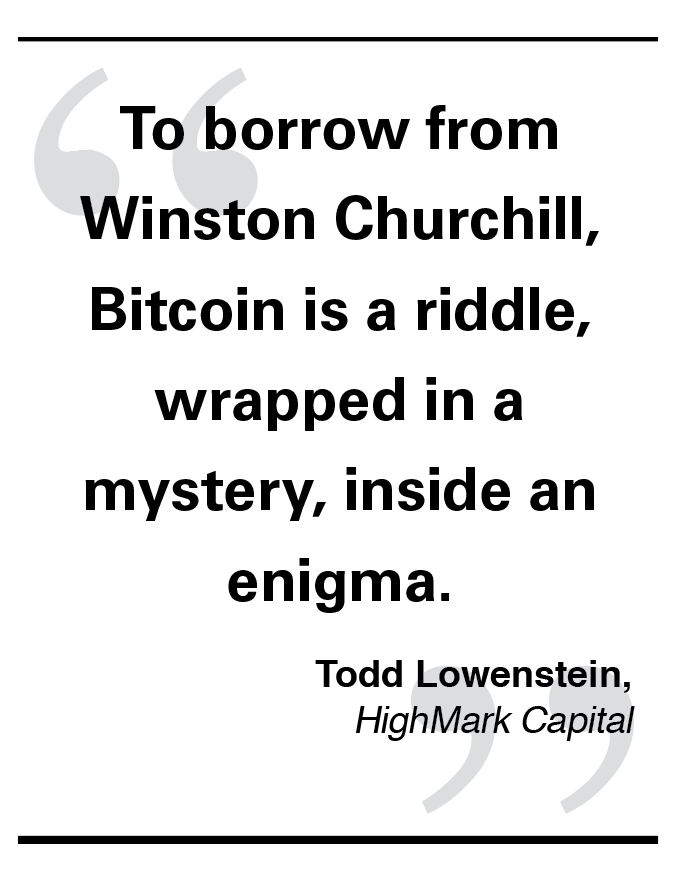 • Lowenstein: To borrow from Winston Churchill, Bitcoin is a riddle, wrapped in a mystery, inside an enigma. Given its meteoric rise and fall, markets vigorously debate whether is it a currency, electronic payment system, unique uncorrelated asset class or simply a digital tulip?
Without question, the underlying blockchain and distributed ledger technology is powerful and will likely play a pivotal role in the future for all sorts of applications including as a payment system, supply chain tracking and verifications, establishing property rights in emerging markets and other yet to be imagined purposes.
The original huge demand for Bitcoin seemed to be based on the notion that widespread government money printing would devalue traditional fiat currencies and therefore there would be interest in alternative assets which better hold their value better without this interference. However, at the end of the day as a currency it is ultimately competing against the government’s ability to print money and control its circulation and when you compete against the government big brother usually wins. The risk of economic activity going underground and the tax base shrinking is too high for governments so they were always going to crack down at some point which they have done on both mining and trading at an increasing rate. Ultimately, it would be reasonable to expect governments and industry to embrace blockchain and cryptocurrencies so you could envision a USD crypto, a Yen crypto and even an Amazon crypto probably with a fixed exchange rate tied to the issuer or other collateral value.
Barriers to entry for cryptocurrencies aren’t very high, last count there was over 1,800 varieties and electricity costs are enormous which isn’t very environmentally friendly. A good rule of thumb is that Bitcoin is probably worth the marginal cost to produce it, I have read that could be $5,000 to $10,000 at this point but declining over time. Gold’s price it generally thought to be supported by the cost to produce it and carries a premium to that cost because of its industrial applications, historical store of value over time as a barter of exchange, and the lure from jewelry.
The price chart of Bitcoin does track most major historical asset bubbles and busts, it also carries a this time its different narrative like other bubbles when they arrived on the scene. Typically these bubbles are accompanied by new technology, loose credit and new faith by a certain segments of the population. Behavioral finance can be a really useful tool to help us uncover these types market risks. Today, the price of Bitcoin reflects pure speculation at this point not anchored to anything of durable intrinsic value.
This reprint is a general communication being provided for informational purposes only. It is educational in nature and not designed to be taken as advice or a recommendation for any specific investment product, strategy, plan feature or other purpose in any jurisdiction. Any examples used are generic, hypothetical and for illustration purposes only. This material does not contain sufficient information to support an investment decision and it should not be relied upon by you in evaluating the merits of investing in any securities or products. Users should make an independent assessment of the legal, regulatory, tax, credit, and accounting implications and determine, together with their own qualified professional advisers, if any investment mentioned herein is believed to be suitable to their personal goals, in addition to obtaining all available relevant information before making any investment decision. Any forecasts, figures, opinions or investment techniques and strategies set out are for information purposes only, based on certain assumptions and current market conditions and are subject to change without prior notice. All information presented herein is considered to be accurate at the time of production, but no warranty of accuracy is given and no liability in respect of any error or omission is accepted. HighMark Capital Management, Inc. (HighMark), an SEC-registered investment adviser, is a wholly owned subsidiary of MUFG Union Bank, N.A. (the Bank). HighMark manages institutional separate account portfolios for a wide variety of for-profit and nonprofit organizations, public agencies, and public and private retirement plans. The Bank, a subsidiary of MUFG Americas Holdings Corporation provides certain services to HighMark and is compensated for these services. Investment involves risks, the value of investments and the income from them may fluctuate in accordance with market and other economic conditions. Both past performance and yield are not a reliable indicator of current and future results. Investments employing HighMark strategies are NOT insured by the FDIC or by any other federal government agency, are NOT deposits or other obligations of, or guaranteed by, the Bank or any Bank affiliate, and MAY lose value, including possible loss of principal.